
Interpreting an XRF Testing Report and Frequently Asked Questions
- Jan 13
- 4 min read
Scientific testing of turquoise by XRF analyses can be a bit dense for the lay person. Neil Ray unwinds the complexity in this report.
Interpreting a P3M Turquoise Report and Frequently asked Questions
Neil Ray, West Texas Analytical Laboratory
P3M is software that was developed over the course of 10 years of research in geochemistry of various rock types. The software calculates mineralogy based on whole rock composition; analogous to the CIPW norm used in igneous rocks. An algorithm identifies the rock type as sedimentary, igneous, metamorphic, or hydrothermal and assigns elements to the allocation of appropriate minerals by rock type. Additionally, the software is used to determine properties such as friability/stability of clays, hydrocarbon potential in shales, pressure/temperature conditions of formation, porosity, etc. Moreover, P3M is used to determine the origin of turquoise against a database of known samples, using trace element geochemistry. This article aims to outline the information presented in a P3M turquoise report with detailed explanations of the data format.
Summary Page
The summary page is a quick reference to the main details of the report, which includes a picture of the specimens analyzed, the probable origin, and the grade of the specimens analyzed. The top includes a list of the specimens analyzed with accommodating text for rock type, hydrothermal for turquoise. Below the picture of the specimens is a brief description of the mineralogy, which includes the top three prominent minerals. Note P3M determines 100 mineral species and if the mineral is not determined it is reported as “Exotic Phases”, which simply means a mineral not determined in the available mineral species within P3M. Comments for additional minerals are reported in the top left corner of the report. The bottom text lists the probable mine origin for each specimen and an assigned total grade. The grading scale is the R2 method for turquoise, which is defined as <50 (no grade), 50-75 (mid grade), 76-80 (high mid grade) 81-85 (high grade), 86-91 (very high grade), and 92-100 (gem grade). The scale uses a weight of 50% for color and 25% each for hardness and matrix. Note that specimen #3, which is not turquoise, is reported as N/A for origin and grade. Additionally, if a turquoise specimen is stabilized, only the origin will be reported and it will be assigned NG for no grade.

Table of Contents
The table of contents lists all accompanying pages in the report, note that in a turquoise report there will be several pages omitted as they are not applicable to turquoise. A report can contain up to 5 specimens or less, if less is analyzed than pages 3-6 maybe omitted (No Sample). Pages 7-14 are ternary classification diagrams reserved for sedimentary, igneous, and metamorphic rocks. Additionally, pages 15-17 determine the swellability and erodibility of unstable clays in sedimentary rocks and page 26 is for the use of additional photos when applicable, which are sometimes provided to detail features under magnification.

Bulk and Trace Element Analyses
This page details the elemental analysis of the specimens, major elements are reported in oxide percents, and trace elements are reported in ppm. The conversion from ppm to percent is to divide the ppm value by 10000, for example 1 ppm = 0.0001% or 10 ppm = 0.0010%. Typically, major elements are reported in oxide percents, because it’s an efective way to account for the balance of the analysis, as the total accounting for oxygen should be close to 100%. It is normal for turquoise to sum lower, typically 70 or 80%, as turquoise contains water that is not accounted for in the chemical analysis. Significantly low values indicate the presence of epoxy, which like water is unaccounted for in the chemical analysis. Stabilized turquoise will have lower values for aluminum (Al2O3) and phosphorus (P2O5) around 15%, about half of the values reported in the example below, unless ofset by high amounts of silicon (SiO2) for a high quartz content. Epoxy in stabilized turquoise efectively “dilutes” the elemental abundances, significantly lowering the copper concentration as well. Note P3M uses an algorithm to calculate sodium and lithium, as both elements are too light to be determined using conventional Xray fluorescence.
)J
|
.Bd..1t pogel
Specimen Ill 1
Specimenlf2 2
Specimenlf3 3
Specimen 114 4
:.20, fc:O, fc203, & U C11lwl11ted
Ref. # jWt. %) | ! | I | 1 |
|
Si02 | 13.11 | 5.69 | 2.18 | 9.62 |
Al203 | 41.14 | 30.29 | 0.63 | 32.56 |
MgO | 1.81 | 1.38 | 8.47 | 1.90 |
cao | 0.47 | 0.17 | 0.27 | 1.66 |
KlO | 0.16 | 0.16 | 0.03 | 2.62 |
Na20 | 0.81 | 0.12 | 0.39 | 3.53 |
P205 | 28.98 | 22.97 | 0.25 | 28.59 |
Ti02 | 0.03 | 0.02 | 0.02 | 0.05 |
MnO | 0.02 | 0.01 | 0.56 | 0.03 |
FeO | 0.64 | 0.08 | 0.03 | 0.47 |
Fe203 | 4.17 | 0.82 | 0.34 | 0.58 |
s | 0.13 | 0.44 | 0.85 | 0.18 |
Cl | 0.00 | 0.01 | 0.09 | 0.03 |
Trace Elements (1111m wt.)
Strontium | 354 | 5 | 5 | 420 |
Barium | 841 | 1380 | 203 | 5451 |
Rubidium | 8 | 2 | 5 | 36 |
Zirconium | 11 | 3 | 5 | 74 |
Molybdenum | 6 | 116 | 11 | 427 |
Vanadium | 64 | 33 | 115 | 830 |
Nickel | 32 | 27 | 477195 | 112 |
Copper | 53482 | 64733 | 4484 | 8795 |
Zinc | 10223 | 559 | 157 | 24929 |
Chromium | 185 | 102 | 80 | 440 |
Lead | 49 | 4 | 80 | 174 |
Arsenic | 468 | 664 | 83 | 280 |
Tungsten | 108 | 239 | 656 | 480 |
Antimony | 290 | 87 | 47 | 31 |
Tin | 23 | 16 | 33 | 16 |
Silver | 16 | 9 | 34 | 36 |
Bismuth | 7 | 5 | 23 | 7 |
Niobium | 3 | 2 | 9 | 45 |
Uranium | 26 | 14 | 64 | 192 |
Thorium | 3 | 2 | 0 | 3 |
Selenium | 6 | 4 | 914 | 5 |
Cobalt | 95 | 29 | 11992 | 52 |
Lithium | 0.44 | 0.04 | 0.04 | 0.00 |
Cllal;.JUons h.1, t,c,,c,r,i compxcd to multiple d.11 sc1t.s 't1111th Nt xar.acv. Mcr-.war..,outlcn m,;ay 6l.st,. 'tlrlhlctl m;rr prco;« erroneous r'"-Suhs.. P3M
;:tUUfflH no lbb.llty tolt\KC,urxJu Iha, m.3Y r h ol lu lHct.
Mineralogy
This page is individually listed for each specimen analyzed and provides the determined mineralogy against 100 mineral species in P3M, if a mineral is not part of the standard minerals reported it will be noted as “Exotic Phases”. It is noted that turquoise only contains 10 to 20 of the available minerals listed and most minerals will be reported as zero, as they are found in diferent rock types from that of turquoise. Calculated properties such as pressure/temperature of formation, mohs hardness, free water above saturation,porosity, and permeability are reported in the upper right of the report. Mohs hardness and porosity are particularly useful in that they provide information on the overall cutability and hardness of the specimen. Permeability is more applicable to fluid dynamics in sedimentary rocks. The bottom right corner of the report contains calculated end member compositions for garnets, which is always N/A for turquoise, as garnets are not associated with turquoise.

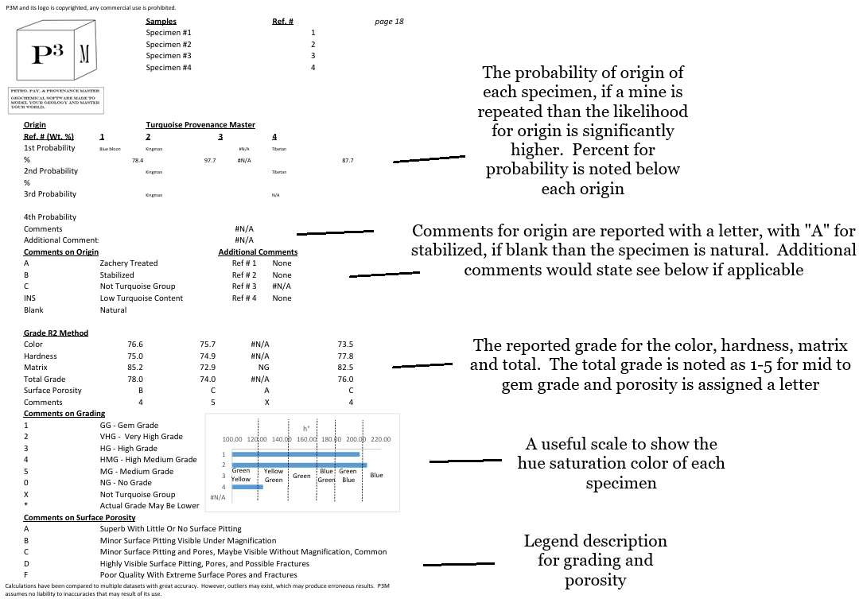
Turquoise Origin and Grade
This page is a detailed analysis showing the determined probability of each specimen and the calculated grade. The first segment shows the probable origin, note that if a mine is repeated then the likelihood of origin is much higher. The percent probability for origin is reported below each mine, note specimen #3 is not turquoise and it is reported as N/A. The comment header assigns a letter (A-C) to represent stabilized or treated turquoise, with natural being blank. Additional comments would indicate “See Below” and they are sometimes attached to noted enhancements or even additional details on origin, an example would be notation of Hardy Pit for Kingman. The R2 Grade lists the grade for the color, hardness, matrix, and total grade with a comment of 1-5 to denote mid grade too gem grade, note that specimen #3 is reported with an “X” as it is not turquoise.
Additionally, it receives an N/A or NG since the grading scale doesn’t apply. Note that if a specimen is stabilized, it will be denoted with the letter “B” and it would receive an NG here for no grade. The surface porosity is denoted by A-F with a legend below describing the porosity characteristics. Finally, a scale showing the hue saturation color for each specimen is provided to show the green to blue characteristics of the stone.
Ternary Diagrams
The report contains a series of ternary diagrams, which are triangle graphs that enable three variables to be plotted at once. The diagrams use several trace elements and show how the analyzed specimens plot in relation to other mines within the database. The diagrams are used in conjunction with a mathematical algorithm to assign the probable origin. The ternary diagrams provide a visual comparison to how the analyzed specimens compare against multiple mines
Hydrothermal Alteration PT Diagram
This diagram, much like the ternary diagrams are used to visualize how the analyzed specimens compare against the hydrothermal pressure/temperature conditions of formation from all mines in the database. The diagram is assigned numerical values for gradient paths that are referred on the accompanying final legend page, which also provides context on the mines referenced in the database.
Frequently Asked Questions - Turquoise Origin and Grade
Q.) XRF just determines elemental chemistry, how are mineral percents determined?
A.) P3M is software that was developed over the course of 10 years of research, which stands for Petro Master, Pay Master, and Provenance Master. Petro Master uses a series of equations to calculate mineral percents based on the rock type and determined elemental analysis; a very similar approach to the CIPW Norm in igneous rocks. Minerals are made up of specified concentrations of chemical elements, in which chemical elements can be allocated to form minerals and using the leftover concentrations to make additional minerals. An example is turquoise, which is a copper aluminum phosphate, a fixed amount of copper/iron is used to calculate the percent turquoise based on the known formula of turquoise and leftover aluminum is used to calculate feldspars and clays. Calculation is beneficial as mineral percents are conventionally determined using X-ray difraction, which unlike X-ray fluorescence is destructive and costly. The calculation has been validated by submitting samples to ActLabs in Canada for XRD analysis and comparison to data published in multiple journal articles with over a 90% accuracy.
Q.) What is x-ray fluorescence and how does it work?
A.) X-ray fluorescence uses an x-ray tube to generate a small amount of x-rays to the surface of a sample. Electrons within an element temporarily jump orbitals emitting secondary x-rays or photons at diferent wavelengths that are characteristic of that element. The intensities of the secondary x-rays are proportional to the concentration of the element in question at a specified wavelength. A photomultiplier tube records the concentrations of elements from magnesium to uranium based on method calibration. P3M uses an additional calculation for sodium and lithium, which has been verified against both ICP-OES and INAA analysis of digested samples from West Texas Analytical laboratory and samples submitted to ActLabs in Canada, as well as data from multiple journal articles with over a 90% accuracy.
Q.) How accurate is the analysis?
A.) Results for origin are computed with a reported probability for each specimen. Inaccuracies in origin reside from two main issues: heavy epoxy exterior treatment and bulky jewelry mounts. X-ray fluorescence cannot determine carbon or hydrogen (hydrocarbons) and polymers are composed of light hydrocarbons; an XRF analysis on a sample of epoxy would show low elemental values. Additionally, as previously mentioned
X-ray fluorescence is a surface analysis method, thus if a rough specimen is coated with a thick layer of epoxy the results will be significantly lower from the epoxy masking the analysis. It is recommended that such specimens of rough be windowed prior to analysis. Typically, jewelry mounts are not an issue if a cabochon is set in a bezel, however problems arise if the cabochon is very small and placed in the center of a large sterling buckle or concho. The analyzer will read a mixture of sterling silver and turquoise, again lowering the elemental analysis of the turquoise. We have somewhat alleviated this issue by placing a non-interfering cushion around the stone prior to analysis.
Q.) Where did you source your turquoise to build a database, after all the results are as good as the specimens you are comparing them to?
A.) The pilot study was done using specimens provided by Mike Ryan with Turquoise in America, a detailed description on the study and methodology can be found as a pdf document on Turquoise in America’s website. I am grateful to numerous people: Shreve Saville with Turquoise Deluxe for sharing material from Grasshopper, Thunder Mountain, and from his personal collection, John Hartman with Durango Silver for providing a variety of Bisbee, Helen and Richard Shull for sharing material from their many claims, Jef Wiley of The Original Turquoise Kings for sharing numerous specimens from the Old Bell collection, just to name a few that have helped the dataset grow larger and increase the accuracy of the algorithm. A significant amount of rarer hard to find mines are provided by a systematic museum collector who wishes to remain anonymous. The collection comes from very
well-known historic miners and Native Americans who had a passion for turquoise. The greatest aspect of receiving specimens from multiple collections and sources is crosschecking material from the same locality, as it was collected at diferent periods in time. The database consists of 150 mines, and it is updated regularly with additional localities. It is possible that a submitted specimen may represent a locality that is not in the database, which will return either a low probability for a locality in the database, or it will be classified as unknown.
Q.) How many mines and samples are in your database?
A.) There are over 2000 samples from 153 mines in the database at the time of this writing. Samples from additional mine localities are constantly being added and the database is updated regularly.
Q.) How does the algorithm work to determine origin?
A.) The algorithm uses two methods to determine origin, a series of ternary diagrams and a series of thousands of logic equations. A ternary diagram is a triangle diagram often used in geochemistry to compare three variables at once, rather than just two as a conventional regression plot. Graphical coordinates are quite useful to determine how something compares against three variables, in this case variation of trace elements. Simply put, logic equations employ an algorithm that states if it’s like this, but not like that than classify it as this and not that. Essentially, imagine if you are holding a sample of turquoise in your hand to identify the origin of it against a bucket of turquoise, which represents many diferent mines. A series of logic equations says it’s like mine A, but not like mine B, but it could also be Mine C, but it’s definitely not like Mine D. Using process of elimination, turquoise from the bucket is removed and the possibilities are narrowed down. Again, another series of logic equations are applied, which narrows down the possibilities further and it is repeated until only a handful of possibilities remain, and a probability is assigned. A final series of logic equations, coupled with the ternary diagram plots narrows the probability down to less than three possibilities.
Q.) How does the algorithm work to determine grade?
The coloration of turquoise is strongly dependent on the concentrations of copper, iron, and zinc, whereas the hardness is dependent on the amount of quartz and clays. The matrix is dependent on the variability of other non-turquoise group elements such as silicon, calcium, and magnesium. Using the concentrations of elements and mineralogy a regression equation can be determined to calculate the color, hardness, and matrix.
Turquoise is complex and for example copper may play a more important role for color at one locality, whereas iron may be a greater factor in another. As such, individual equations attaining to color, hardness, and matrix are applied to each mine in the database, rather than one equation for color, harness, or matrix. Hardness is strongly dependent on quartz and clay content, as well as the type of clays present in the specimen. Illite and smectite group minerals do not polish well and are prone to deterioration, whereas chlorite in quartz may take a substantial polish and add to the matrix appeal. As such regression fit equations for each mine projects a better suited grade.
Q.) If you analyze a piece of turquoise in two diferent spots on the same stone the results will be diferent, just because the matrix is not uniform, wouldn’t that cause errors?
A.) Yes, the same stone analyzed in multiple spots may yield diferent results, but the ratio of trace elements will be the same. Suppose for example that the matrix contains more quartz in one spot, which lowers the amount of lead and arsenic. The lower amounts of both lead and arsenic displays a pattern with increased quartz, which is indicative of that mine. The ternary diagrams also are normalized too three variables, which will plot in a region of a known mine regardless of the exact concentration of an element, as 100 ppm of one element and 20 ppm of another element is the same ratio of 10 ppm of that element compared against 2 ppm of the other.
Q.) What is the most common misidentified turquoise and what type of turquoise do you routinely see mislabeled by dealers?
A.) The most common misrepresented turquoise used to be Lander Blue, as it is well known that only a handful of Lander Blue was ever mined. The ongoing saying is there is more Lander Blue available now than what has ever been mined. High grade Hubei turquoise has been sold to buyers as Lander Blue, but it is typically a case of a transfer of false provenance. In the 1990’s Hubei turquoise entered the market, and a few fraudulent dealers would pass the material of as Lander Blue. The buyer at the time accepts the dealer’s word that it is authentic lander Blue, and the piece of turquoise may change hands a few times with the original false provenance passed down accordingly. Bisbee turquoise is even more misrepresented with the same issue of passed down false provenance. A new ongoing scam is where someone of the street walks into a shop in Bisbee and sells a dealer pounds of Bisbee rough, claiming that their grandfather mined it during the early days of Bisbee’s operations. Such a statement should raise flags, as although it’s well known that miners would smuggle out turquoise, it is highly unlikely that the miners would smuggle out pounds of material. The reality is that the individual of the street recently acquired a parcel of Kingman that they are making false claims, selling it to the unwary dealer. The dealer again takes the person’s word for it, marks up the material for resale and passes the false provenance to the consumer. It truly is a case of buyer beware for both the dealer and the consumer.
Q.) How do I use the report to sell my turquoise?
A.) It is recommended to post a copy of the summary page in any sales listing you have, as the report shows the probable origin, grade, and a picture of the material identified in the analysis. Posting the summary page gives the buyer the opportunity to cross reference the material that was analyzed against what is being sold for grade and identification. Sadly,
we have seen scammers either steal someone else’s report to use as their own or the person that had the analysis done attempt to sell cheaper material that looks similar to what they had analyzed, claiming it’s the same material tested. Additionally, sometimes specimens of rough are selected from a bucket of miscellaneous turquoise and it’s presumed that the specimen that was analyzed represents the entire bucket of material. Sometimes the specimen is representative of what was tested and sometimes it is not, which is another reason the summary report is beneficial to the buyer.

Interesting info! Thanks Mike!
Great report. What does a test cost?